Saturday 28 January 2023

End-to-end example of Predictive models with MLFlow

 Building a Baseline Model

It uses MLflow to keep track of the model accuracy, and to save the model for later use.


from mlflow.models.signature import infer_signature

from fbprophet import Prophet

from sklearn.metrics import mean_absolute_error, mean_squared_error

class FbProphetWrapper(mlflow.pyfunc.PythonModel):

def __init__(self, model):

self.model = model

def predict(self, context, model_input):

return self.model.predict(model_input)

with mlflow.start_run(run_name='base_prophet_model'):

model_fbp = Prophet()

#for feature in exogenous_features:

# model_fbp.add_regressor(feature)

model_fbp.fit(train)

forecast = model_fbp.predict(test[["ds", "y"]])

test["Predicted_Prophet"] = forecast.yhat.values

MAPE = mean_absolute_percentage_error(test.y, test.Predicted_Prophet)

print(MAPE)

#mlflow.log_param('exogenous_features', exogenous_features)

mlflow.log_metric('RMSE', np.sqrt(mean_squared_error(test.y, test.Predicted_Prophet)))

mlflow.log_metric('MAPE', mean_absolute_percentage_error(test.y, test.Predicted_Prophet))

mlflow.log_metric('MAE', mean_absolute_error(test.y, test.Predicted_Prophet))

wrappedModel = FbProphetWrapper(model_fbp)

signature = infer_signature(test[["ds", "y"]], wrappedModel.predict(None, test[["ds", "y"]]))

mlflow.pyfunc.log_model("prophet_model", python_model=wrappedModel, signature=signature)


Registering the model in the MLflow Model Registry

By registering this model in the Model Registry, we can easily reference the model from anywhere within Databricks.

The following section shows how to do this programmatically, but we can also register a model using the UI


run_id = mlflow.search_runs(filter_string='tags.mlflow.runName = "base_prophet_model"').iloc[0].run_id

model_name = "inc_vol_pred"

model_version = mlflow.register_model(f"runs:/{run_id}/prophet_model", model_name)


We should now see the inc_vol_pred model in the Models page. To display the Models page, click the Models icon in the left sidebar.

Next, transition this model to staging and load it into this notebook from the model registry.


from mlflow.tracking import MlflowClient

client = MlflowClient()

client.transition_model_version_stage(

name=model_name,

version=model_version.version,

stage="Production",

)


The Models page now shows the model version in stage "Production”. We can now refer to the model using the path "models:/ inc_vol_pred/production".


model = mlflow.pyfunc.load_model(f"models:/{model_name}/production")

# Sanity-check: This should match the AUC logged by MLflow

forecast = model.predict(test[["ds","y"]])

#print(forecast)

MAPE = mean_absolute_percentage_error(test.y, forecast.yhat.values)

print(f'MAPE: {MAPE}')


Experimenting with a hyper optimized model

The model performed well even without hyperparameter tuning.

The following code runs a parallel hyperparameter sweep to train multiple models in parallel, using Hyperopt and SparkTrials. As before, the code tracks the performance of each parameter configuration with MLflow.


from hyperopt import fmin, tpe, hp, SparkTrials, Trials, STATUS_OK

from hyperopt.pyll import scope

from math import exp

import numpy as np

from mlflow.models.signature import infer_signature

from fbprophet import Prophet

class FbProphetWrapper(mlflow.pyfunc.PythonModel):

def __init__(self, model):

self.model = model

def predict(self, context, model_input):

return self.model.predict(model_input)


search_space = { 'changepoint_prior_scale': hp.uniform('changepoint_prior_scale', 0.001, 0.5), 'seasonality_prior_scale': hp.uniform('seasonality_prior_scale', 0.01, 10), 'seasonality_mode': hp.choice('seasonality_mode', ['additive','multiplicative']) }


def train_model(params):

with mlflow.start_run(nested=True):


model_fbp =Prophet(changepoint_prior_scale = params['changepoint_prior_scale'],

seasonality_prior_scale = params['seasonality_prior_scale'],

seasonality_mode = params['seasonality_mode'])

model_fbp.fit(train)

forecast = model_fbp.predict(test[["ds", "y"]])

test["Predicted_Prophet_ht"] = forecast.yhat.values

#test["Predicted_Prophet"] = forecast.yhat.values

#mlflow.log_param('Parameters', params)

mlflow.log_param('changepoint_prior_scale', params['changepoint_prior_scale'])

mlflow.log_param('seasonality_prior_scale', params['seasonality_prior_scale'])

mlflow.log_param('seasonality_mode', params['seasonality_mode'])

MAPE = mean_absolute_percentage_error(test.y, test.Predicted_Prophet_ht)

print(MAPE)

#mlflow.log_param('exogenous_features', exogenous_features)

mlflow.log_metric('RMSE', np.sqrt(mean_squared_error(test.y, test.Predicted_Prophet_ht)))

mlflow.log_metric('MAPE', mean_absolute_percentage_error(test.y, test.Predicted_Prophet_ht))

mlflow.log_metric('MAE', mean_absolute_error(test.y, test.Predicted_Prophet_ht))

#mlflow.log_metric('MAPE', mean_absolute_percentage_error(test.Freq, test.Predicted_Prophet))

#mlflow.log_metric('MAE', mean_absolute_error(test.Freq, test.Predicted_Prophet))

#model_fbp.plot_components(forecast)

#test[["Freq", "Predicted_ARIMAX", "Predicted_Prophet"]].plot(figsize=(14, 7))

wrappedModel = FbProphetWrapper(model_fbp)

# Log the model with a signature that defines the schema of the model's inputs and outputs.

# When the model is deployed, this signature will be used to validate inputs.

signature = infer_signature(train, model_fbp.predict())

mlflow.pyfunc.log_model("prophet_model", python_model=wrappedModel, signature=signature)

return {'status': STATUS_OK, 'loss': MAPE}

#spark_trials = SparkTrials(parallelism=4)

trials = Trials()

rstate = np.random.RandomState(42)

with mlflow.start_run(run_name='hyperoptimized_prophet_model'):

best_params = fmin(

fn=train_model,

space=search_space,

algo=tpe.suggest,

max_evals=10,

trials=trials

)


Use MLflow to view the results

Open the Experiment Runs sidebar to see the MLflow runs.

MLflow tracks the parameters and performance metrics of each run.


We used MLflow to log the model produced by each hyperparameter configuration. The following code finds the best performing run and saves the model to the model registry.


best_run = mlflow.search_runs(order_by=['metrics.MAPE ASC']).iloc[0]

print(f'MAPE of Best Run: {best_run["metrics.MAPE"]}')

#best_run


Updating the production wine_quality model in the MLflow Model Registry

Earlier, we saved the baseline model to the Model Registry under " inc_vol_pred ". Now that you have a created a more accurate model, update inc_vol_pred.


new_model_version = mlflow.register_model(f"runs:/{best_run.run_id}/prophet_model", model_name) version = result.version


Click Models in the left sidebar to see that the inc_vol_pred model now has two versions.

The following code promotes the new version to production.


# Archive the old model version

from mlflow.tracking import MlflowClient

client = MlflowClient()

client.transition_model_version_stage(

name=model_name,

version=model_version.version,

stage="Archived"

)


# Promote the new model version to Production

client.transition_model_version_stage(

name=model_name,

version=new_model_version.version,

stage="Production"

)


Clients that call load_model now receive the new model.


loaded_model = mlflow.pyfunc.load_model(f"models:/{model_name}/production")

forecast = loaded_model.predict(pd.DataFrame(test[["ds","y"]]))

#print(forecast)

MAPE = mean_absolute_percentage_error(test.y, forecast.yhat.values)

print(f'MAPE: {MAPE}')

The rise of Entrepreneurial Engineers


I often use the sentence – Good engineers build things; great engineers build valuable things. But the idea of value is abstract, what might be valuable to one person may not be valuable to another. But it is not so, when it comes to profitable organizations. Here ultimately it should end up – in contributing to organization value while complying all governance checks. I have seen engineering colleagues wondering if we should worry about all this. May be 5 years back the answer would have been not necessary, but now it’s necessary. The rise of Entrepreneurial Engineers is like what we observed with rise of Citizen Data Scientist, but also the other way around. The idea is, though this engineering team still works with the Business Owners and Product owner & management team, they have skin in the game of what gets build. They understand business priorities and are driven towards solving customer problem and adding business values. They are aware how to apply their engineering mindset to solve impactful problem using sustainable solutions. 

With teams I work with, it is something we continuously work towards. Some of the steps, I work towards with my team, and I can recommend are:

Before adopting any feature, we try to ask ourselves:

  1.  How will this feature add value?
  2. What will happen if we don’t adopt this feature?
  3.  How is this problem currently addressed?
  4. Can we find out the financial impact & Return on Investment on this feature?

All this can be documented under different artifacts like – CONOPS document, Value document, User story etc. 

Teams I work with, with experience, we have discovered, learned, and created a process of continuous – conversation & collaboration. It is a cycle of continuous conversation with other stake holders. Some of the check points we have developed over the years, are - 

  1. Do an internal tech team analysis – feasibility, compatibility & valuation analysis
  2. Present understanding, POC or plan to business leaders, owners & SMEs.
  3. Broader Technology team peer presentation
  4. Discussion with vendor to clarify assumptions, if required
  5. Discuss with enterprise architects how this piece will interact with overall architecture
  6. Then start the implementation

But there may be scenarios, where, before being able to do any of this, you might need to have an MVP in place before you can have any discussion. This strategy is extremely useful when the overall team is not too sure, building what would be valuable. Its when, all the stakeholders, see a tangible MVP in front of them, they start to share improvement ideas. In most new product development lifecycles, first few features, are developed like this, until the process matures.

In the last decade with more engineers in board rooms than ever, this new breed of entrepreneurial engineers will be a significant player in the organizational vision & roadmap. The organizations which will thrive & grow, will need to have 2 things:


·         Superior product-market fitment

·         And a good product - Design & Architecture


Organizations should put a lot of focus in these two areas. Once these two are in place, it enables the Sales & Marketing team to effectively do theirs. Organizations & teams should be very aware that all operation & enabling process should be focused around improving these 2 areas. Once a solid foundation of these is in place, Customer relationship & Delivery should take care of themselves.


Sunday 18 December 2016

FUNDAMENTAL AND BASIC DIGITAL MARKETING ‘To–Do’s FOR SMEs

First of all, just to make something clear I am not a digital marketing wizard.But rather I have been founders of few organizations and had to do the digital marketing myself, as I didn’t have enough fund to have a digital marketer.
To put a disclaimer my suggestions may not be the best by the book, but they are the ones which worked best for me, are affordable and are easy to do.

So here they go, these in the order of which I implemented for my organization –
1) Have a Facebook page:
I know many people will rather have a website first, and that is not wrong by any means. The advantage of a Facebook page is-it is free, whereas for the website you will need a domain which will cost you some money. Having a Facebook page will let you have some form of internet presence as a starter. You can share the page with your friends and acquaintances and get your idea or product validated.It will be a bonus if you can get some kind of Facebook page ad going, which you subscribe to with a reasonable amount.

2) Have a twitter account:
Whatever holds true for Facebook also holds true for twitter. Why we need both twitter and Facebook? Because there is a lot of social media users who are exclusive to either Facebook or twitter.

3) Create a website:
A website is a World Wide Web footprint every business and organization needs. It tells the visitor who you are and what you do.A good website goes a long way in creating trust and understanding among visitors.The domain should be representative of the organization.It lets one have a single point of entry for all social media platforms.

4) Register your website with Google and enable Google Analytics:
Register your website with Google to be crawled by Google bots thus enabling it for Google ranking. I think no one will dispute the importance of a website to show up in Google ranking.You can do some basic SEO, but do not spend too much effort or resources for SEO now. Then go ahead and set up your Google analytics. The basic version of Google analytics is a free product and can be extremely useful to analyze your visitor's demography and website performance.

5) Google Ad words and PPC:

It’s said – ‘Google’s’ 2nd page is the best place to hide a dead body.' And it’s not so easy to get to Google’s first page, especially if you have chosen a popular keyword. Well researched keywords and strategic Pay Per Click campaign can give one some good inorganic reach until he/she gets their website's organic ranking higher

Friday 24 June 2016

Prediction of EURO 2016 using just a spreadsheet and some publicly available data

The following analysis is an exercise I performed to predict the outcome of EURO 2016 .My resources were just a spreadsheet and some publicly available data.

Some of the hypothesis taken for this prediction are:
  1. Players playing in bigger clubs(club ratings as per UEFA) will perform better in Europe.
  2. Best players in European countries play in European club.
  3. The strength of the 23-member squad will better determine a nation's performance rather than just starting 11.
  4. Every position be it goal-keeping, defense, midfield or striker matters equally to the success of a nation.

Factors not taken into consideration:
  1. Form of the player
  2. Team work
  3. Confidence of an individual player
  4. Home advantage
  5. Injury
  6. Credibility of the manager

Steps followed in the analysis:
Step 1: 23 squad members list of each country is collected -- their names and the clubs they play for.
Step 2: List of 400 clubs across Europe was collected and their standings as per UEFA.

For my final analysis I only considered top 100 clubs from the list of 400 clubs with the hypothesis that a player can only make an impact if he plays among the top 100 clubs in Europe. I divided the 100 clubs in 10 segments of 10 clubs each. Then I rated each club with the top segment getting 10 points and the bottom getting 1 respectively. Then I looked up all the players in each nation and rated them based on their club ratings. The result is a cumulative rating for each country. Then going to the fixtures I concluded on the results with the assumption that a nation with higher rating will progress through the tournament whereas a nation with a lower rating will not.

Prediction :

Quarter Final teams:Ukraine,Spain,England,Belgium,Germany,Italy,France,Russia

Semi Final teams:Spain,Belgium,Germany,France

Final:Spain,Germany

Champion:Spain
Runner-up:Germany

The analysis may seem simplistic, but one of the main objective of the exercise is to encourage readers to start doing analysis on simple use cases and realize beyond the smoke screen of data science jargon that its not that complicated.Once an analyst completes a use case like this, he experiences a complete analytics life cycle.But what will generally change for a detailed analysis will be -- the volume of data and the numbers of factors to be considered..


Learnings that we may receive from this exercise can be -

Searching for the right data : The use case and the hypothesis tells us what data to search, gather or ask the business for.Lots of time in my career I have seen analysts being handed some data and asked to find something interesting.That should not be the case.It should be the business use case driving the analysis.

Data preparation: You must have heard the 80-20 rule,where 80 % time is spent preparing the data and 20 % time doing the actual analysis.My data was web links so I had to scrape it, massage it and clean it to get it in a shape that can be used for analysis.

Feasibility of the variables to consider : The complexity and the accuracy of the algorithms mostly depend on the suitability of the algorithm for the use case, the extent of variables considered and the size of the data analyzed. Looking at the timeline and resources in hand one should decide how extensively one wants to go about it.

Consideration of hypothesis : Hypothesis considered should be clearly mentioned as part of the analysis.The result of the analysis will prove or disprove our hypothesis.


Saturday 30 April 2016

EMI – The dream killer – an Indian software engineer's perspective.


'Well,I had a dream' – The words you will often hear from souls STUCK in IT suffering from mid-career crisis. 'But what happened,why didn't you follow it,DELL did,JOBS did,GATES did,our own BANSALS did,you may ask.''Well you see,abroad its easier financially, and I had EMIs to pay'.Then who is to blame – the poor souls who have to leave their hometown,and come and settle down in the unknown land,and has to start everything from scratch ? EMI is a reality for them. Although there are few chosen ones who gets to travel the fairyland(read 'US','Europe') and can save enough money to pay the devil's due in advance but for others there is no way out. So the EMI killed their dreams – Dreams to start their business,to set up that start up,to make that travel. But can you blame them ? I won't. Anyways they get blamed enough everyday by the traffic police, corporation, maids, autowallas for not learning the local language anyways.:).

Sunday 5 July 2015

10 THINGS TO KEEP IN MIND FOR AN ANALYTICS PROJECT

  1. Before you start solving your analytics use case, ask yourself – how significant the change will be for the business if you get the perfect answer to your question. If the change is not significant enough don’t even bother to start solving it.
  2. The objective of your project should be a business problem or a strategic solution. If you see yourself solving a tactical or IT problem, remember you are impacting the means to an end but not the end.
  3. Decide what you want to do – assign a weight age to a factor customer already knew about or give insight on a factor customer didn’t knew affects his business. For example, while doing analytics on student’s attendance, an insight for the former case would be – whenever it rains the student’s attendance drops by 27 %.Here the school always knew, rain has an adverse effect on the attendance but they never knew it was 27 %.(This can appear as contradicting to point 2, but for some cases that is what specifically asked by the customer. But whenever possible try avoiding it.)For the latter case it would be whenever there is a bank holiday student’s attendance will be negatively affected. This is something the school never knew about.
  4. Always make sure you ask your customers deviation percentage to the actual business value that can be considered as prediction success. Because as good as your analytics may be, you will never be able to capture all the influencing factors affecting his business numbers. For example – The customer can say ‘if your predicted sales is 5% on either sides of my actual sales I will consider it as correct.’
  5. While doing analytics for your customer, whenever possible, try avoiding giving your insight as an absolute value .Because no matter how many factors you may have included in your analysis, there will always be those unknown ones, which can turn your prediction wrong. Rather try to rank the factors influencing customers business based on their influence. The business thus can plan better what to concentrate on as priority.
  6. Ask the customer what is the offset of an event. Means what is the lag between an event occurring and its results getting reflected. For example an ad campaign being launched and the timeline around which the sales gets lift may have an offset of 2 months among them. This changes from product to product, depending on the factors and results. For some it may even be instantaneous.
  7. Try to understand from your customer what does significant change means to him. A value may be significant change to one customer but not to another.
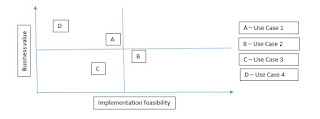
  8. Don’t try to pick the use case, pick a use case. When you are talking to the business, let the business choose the use case for you. Just provide them the below matrix.
  9. Whichever use case you choose to implement will have multiple source systems of data. For most of the cases it’s not possible to include every source system as part of the analytics. To decide which source systems to spend your time on, use the below graph –  
  10. Don’t try to answer all the business questions. Rather try to give insights which will enable the business to ask more questions. No one will know his business more than the business owner.

Wednesday 18 February 2015

HADOOP – HOT INTERVIEW QUESTIONS - What is the responsibility of name node in HDFS?

  1. Name node is the master daemon for creating metadata for blocks stored on data nodes.
  2. Every data node sends heartbeat and block report to Name node.
  3. If Name node does not receive any heartbeat then it simply identifies that the data node is dead. The Name node is the single point of failure. Without Name node there is no metadata and the Job Tracker can’t assign tasks to the Task Trackers.
  4. If Name node goes down HDFS cluster in inaccessible. There is no way for the client to identify which data node has free space as there is no metadata available in the data node.